Top 10 Call Center KPIs You Should Be Tracking

Let’s say you’re a Sales, Ops, or IT manager in a bustling call center for a growing software company. It’s 10 a.m., and your team is juggling a surge in call volumes while you sift through dashboards full of metrics. You’re trying to figure out which numbers truly matter—are you focusing on the right KPIs, or is something slipping through the cracks?
Call center KPIs are your compass, helping you measure the quality of calls, track employee performance, and align operations with business goals. But with so many metrics to choose from, how do you decide what’s essential? How can you avoid information overload and focus on what drives results?
To help you cut through the noise, we’ve identified the 10 most important call center metrics every manager should track. Let’s dive in and ensure your team stays ahead.
Key Takeaways:
- Monitoring Key Performance Indicators (KPIs) is necessary for tracking performance and benchmarking your goals.
- Selecting the right combination of KPIs and metrics ensures that the call center operates efficiently, your agents perform optimally, and your customers can rely on your business.
- Call center KPIs should measure call center metrics such as overall customer satisfaction, first call resolution time, abandonment rate, waiting time, blocked calls, and time agents spend on reporting.
Optimize call center KPIs today
Best KPIs to Use in Your Call Center
To drive impact, measure success, and locate improvement areas, it is crucial to track the right call center KPIs. Below, we rank them in order of importance.
#1 Customer Satisfaction (CSAT)
Without satisfied customers, even the most efficient call center won’t succeed. Customer satisfaction is a direct reflection of how well your team meets expectations, influences retention rates, and impacts overall business growth. A high CSAT score means your service is working, while a low one is an early warning sign of deeper issues. The quickest and most effective way to uncover the reasons behind customer dissatisfaction is through surveys, which provide valuable insights into:
- Customer perceptions of your product or service
- The challenges they face
- Areas for improvement
#2 Net Promoter Score (NPS)
While NPS might seem identical to Customer Satisfaction score, there’s a slight difference. A Customer Satisfaction score only counts the satisfaction of a customer at a given moment. Meanwhile, Net Promoter Score measures how likely a customer is to recommend a product or service to others.
High NPS means your customers are satisfied with your product and quickly turning into brand champions. This helps you create a feedback loop of loyal customers who buy more often and turn other customers into raving fans. Since administering NPS surveys is easy and fast, it’s a great way to find out which customers are the most loyal and which are likely to churn.
#3 Number of Blocked Calls
This KPI shows you the percentage of callers that heard the busy tone when placing a call. If your customers encounter this, it typically means all of your agents are busy, or that technical issues are preventing your agents from answering the call.
To improve this metric, you need to find out what’s causing the high number of blocked calls (understaffing, lack of adequate training, technical issues, to name a few) and then look for a solution. For example, better workforce planning can help you schedule more agents during peak hours, while addressing skill gaps with training ensures agents handle calls more efficiently.With CloudTalk’s Intelligent Call Routing, you can take this a step further by connecting each customer to the most suitable agent based on interaction history and preferences. Paired with Interactive Voice Response (IVR), customers are guided through personalized routing options, ensuring that agents are better prepared for the conversation before it even starts.
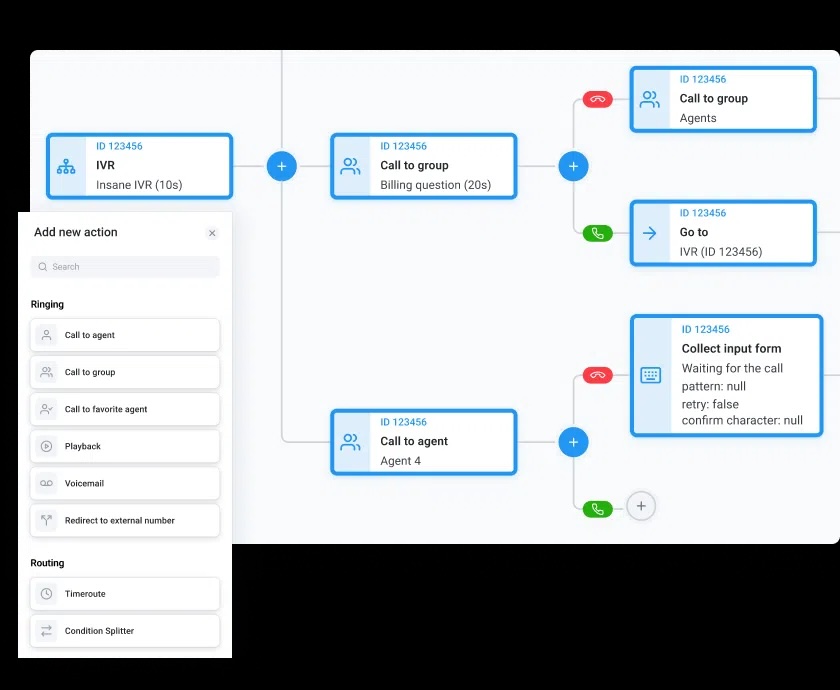
Additionally, features like voicemail management allow customers to leave detailed messages when lines are busy, helping you minimize missed opportunities and maintain customer satisfaction.
#4 Call Arrival Rate
This metric tracks how many calls come in each day over the course of a month. By keeping an eye on the Call Arrival Rate, you can spot your busiest times when extra agents might be needed and slower periods when fewer agents can handle the load.
It’s also great for flagging any random spikes or dips in call volume that might need a closer look. With this data in hand, you can plan ahead, schedule your team smartly, and make sure you’ve got just the right coverage during peak hours—without overstaffing when things are quiet.
Turn customer insights into action
#5 Average Wait Time (AWT)
This metric shows how long callers spend in the queue before they’re connected to an agent—calculated by dividing the total queue time by the number of calls answered.
Why does this matter? Because no one has time to sit on hold for ages.
In fact, 60% of callers won’t wait on hold for more than a minute. The longer your callers are stuck waiting, the more likely they are to abandon the call and leave frustrated feedback. Keeping this number low is key to keeping your customers happy.
#6 Average Time to Abandon (ATA)
This metric tracks the percentage of calls where customers hang up before they get connected to an agent. A 2-5% abandonment rate is standard, but if it creeps above 5%, it’s time to dig into what’s going on.
It could be that your team is understaffed during peak hours, leaving customers waiting too long. Or maybe technical issues are slowing your agents down and making it harder to handle calls efficiently. Whatever the cause, remember: Every caller who hangs up is a missed chance to make a connection—and possibly a sale.
#7 Average Handle Time (AHT)
Average Handle Time measures the entire journey of a call—from when a customer dials in to when the agent wraps up any post-call tasks and is ready for the next one. It includes time spent in the queue, talking to an agent, and any follow-up work after the call.
It’s a solid metric for gauging agent efficiency and performance. But here’s the catch: Don’t over-optimize. Pushing agents to rush through calls might lower your AHT, but it’ll likely frustrate your customers. Balance is key—focus on efficient calls that still leave customers feeling heard and satisfied.
Pro tip
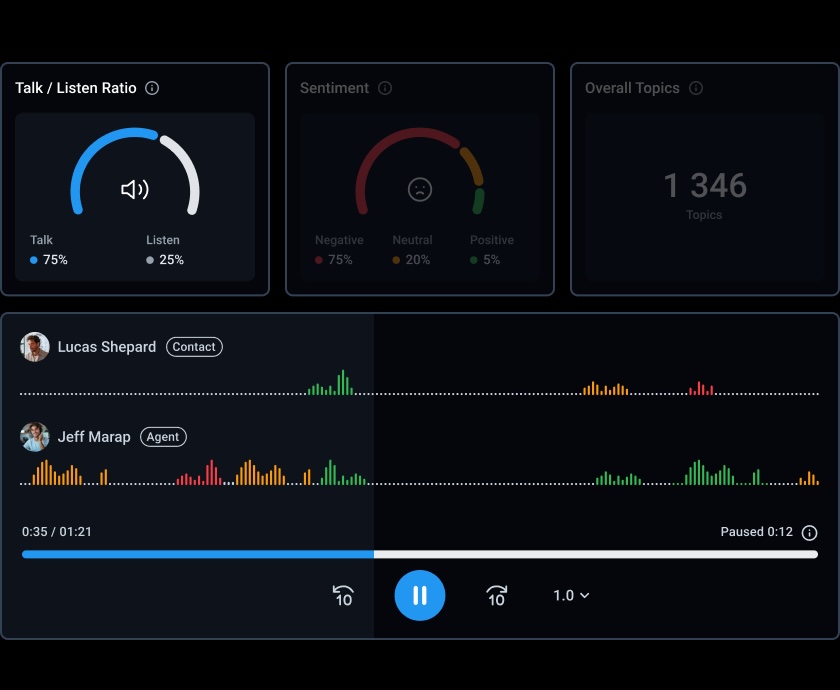
Use the Talk/Listen Ratio to track how much your agents talk versus how much they listen. A balanced conversation keeps customers engaged and helps uncover valuable insights. For example, if an agent talks 80% of the time, customers may feel unheard. Coaching them to aim for a 60/40 split, with more listening, can lead to better understanding, higher satisfaction, and stronger outcomes.
#8 Average After-Call Work Time (ACW)
Average After-Call Work Time (ACW) tracks how long agents spend on post-call tasks, like updating records, completing reports, or following up. It’s a key metric for understanding how much time your team spends wrapping up calls and preparing for the next one.
If your After Call Work (ACW) metric is higher than you’d like, it could mean your agents need more training or are overwhelmed with post-call tasks. A smart fix? Train agents to handle some of these tasks during the call itself.
Tools like CloudTalk can make a huge difference here. By integrating seamlessly with your CRM, CloudTalk can automatically update customer records, reducing manual work for agents. Plus, our Agent Reporting feature gives you a clear view of team performance so you can spot coaching opportunities, streamline onboarding, or even recognize standout team members for their efforts.
#9 First Call Resolution (FCR)
First Call Resolution (FCR) measures a call center’s ability to resolve a customer’s issue on their first call, without needing follow-ups. Resolving a customer’s issue on the very first call is one of the easiest ways to boost your reputation, improve customer satisfaction, and build loyalty.
On the flip side, making customers repeat their issue to multiple agents across several calls can lead to frustration, negative feedback, and even losing them to a competitor. FCR doesn’t just measure how well your team is resolving problems—it reflects how seamless and efficient your customer experience really is.
Investing in tools like call routing systems or knowledge-sharing platforms can help ensure the right agent handles the issue the first time, every time. This not only keeps your customers happy but also reduces overall call volume and saves valuable time for your team.
#10 Agent Turnover Rate
Tracking customer satisfaction is crucial, but don’t forget to keep an eye on your agents too—they’re the backbone of your customer support team. When your agents feel positive, supported, and motivated, it has a ripple effect on both customer service quality and overall team morale.
But if your agents are leaving after a short time, forcing you to constantly recruit and train new hires, that’s a red flag. High employee turnover doesn’t just disrupt team dynamics; it also eats up valuable time and resources.
If this sounds familiar, it’s time to dig deeper. Regularly check in with your team to understand what’s driving dissatisfaction. Is it workload, a lack of career growth, or something else? Addressing these issues not only reduces turnover but helps create a supportive, productive environment where your agents—and your customer support—can thrive.
Key Call Center CX Metrics: CSAT, NPS, and Retention Rate
Some call centers may prioritize different KPIs based on their specific needs:
- Customer satisfaction scores (CSAT): Measures how happy customers are with their experience.
- First call resolution (FCR): Tracks how effectively agents solve issues on the first call.
- Average handle time (AHT): Crucial for high-volume operations where efficiency is key.
The reason these KPIs vary is simple: Every business has unique goals, customer expectations, and operational realities. What works for one company might not be the best fit for yours. That said, the most popular contact center CX metrics remain CSAT, NPS, and retention rate*.
Choosing the right mix of metrics ensures your call center operates efficiently, your agents perform at their best without burning out, and your customers feel confident in your service.
With CloudTalk, you can easily track and manage the most critical metrics for your business, helping you stay on top of performance and deliver exceptional customer experiences.
Start tracking the right call center KPIs
*Sources
CMSWire. Call Center Statistics.
Frequently Asked Questions About Call Center KPIs
What are examples of call center KPIs?
Examples of call center KPIs include average handle time, first call resolution, customer satisfaction score, service level, and call abandonment rate.
Where can I find a call center KPI dashboard?
You can find a call center KPI dashboard in tools like CloudTalk, which offers real-time tracking and insights to optimize performance and efficiency.
What’s the definition of call center KPIs?
Call center KPIs are metrics used to measure performance, efficiency, and customer satisfaction, leading to improvements and achieving business objectives.
What is a call center KPI scorecard?
A call center KPI scorecard is a tool that tracks key performance metrics, helping managers monitor efficiency and improve customer service.


